The War to End All Wars, and The Great War were two names that are used to describe the horrible tragedy, WWI. This war occurred from 1914-1918, and it revolutionized the face of warfare as we know it. What made this war worse than any other war? The invention of new technology such as the automatic machine gun, the airplane, and the submarine caused the death toll of this war to skyrocket to new heights.
We started off this chapter learning about the causes of World War I. We also learned about the efforts for peace, like the first Modern Olympic Games.
We started off this chapter learning about the causes of World War I. We also learned about the efforts for peace, like the first Modern Olympic Games.
Allied Powers Bar Graph Central Powers Bar Graph
10-10-14 10-10-14
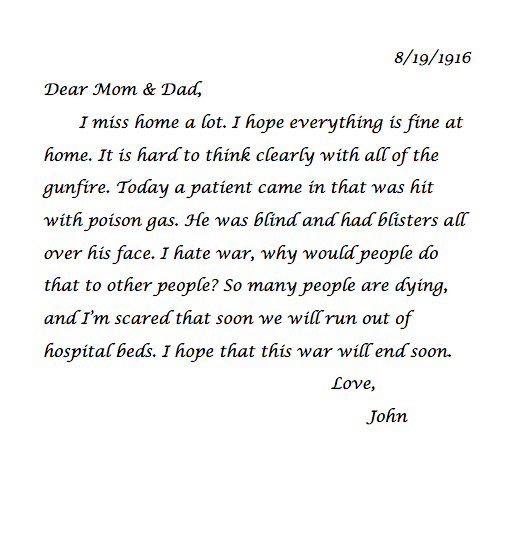
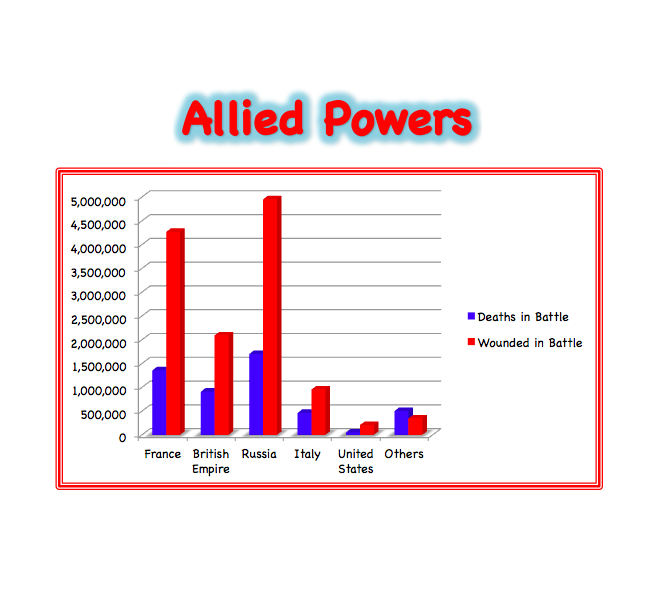 This bar graph shows the number of deaths and wounded soldiers in the Allied Powers during WWI. The blue represents deaths and battle and the red represents wounded in battle. If I were to change this bar graph, I would add a different color of background instead of white. Picture Book |  This bar graph shows the number of deaths and wounded soldiers in the Central Powers during WWI. The blue represents deaths and battle and the red represents wounded in battle. I would change the color of the background and the color of the bars. Letter to Family |
 RSS Feed